A guide to developing effective questionnaires with a clear purpose, precise questions, consistent scales, and a natural flow — as well as how you test, improve, and translate the results into decision-relevant insights (Best Practice Guide).


Because poorly designed questionnaires cost time, credibility, and lead to decisions based on incorrect data.
This article gives you an easy-to-understand, professional, and research-based walkthrough of survey best practices, classic do’s and don’ts, and typical pitfalls in questionnaire design.
You get:
In short:
If you work with surveys – once a year or every week – this article will save you from mistakes, frustration, and bad decisions.
Before you write the first question, you must be very clear about why you are conducting the survey. What decision should the results support? Are you improving customer experience, testing a new product, or measuring employee satisfaction?
“A good questionnaire is not easy to make, … but through our many surveys and evaluations, we have built extensive knowledge about how to formulate questionnaires that answer exactly what you want to shed light on.” (1)
A clear purpose makes it easier to choose relevant questions and remove everything that does not create value. A concrete objective could be formulated as:
“We want to understand why our customers leave us after the trial period.”
An unclear purpose creates three serious problems:
When the purpose does not guide the design, the questionnaire becomes longer, more random, and less useful.
When the purpose is defined, you should consider who you want answers from, and how they will experience the questionnaire. What background do the respondents have? How much time do you expect them to invest? And what device will they most likely use to complete it?
A good questionnaire meets respondents on their own terms and uses their words and concepts - not the company’s internal language. (2)
Ask yourself:
Consequences of ignoring the target group:
These are classic questionnaire errors that produce data you cannot use strategically.
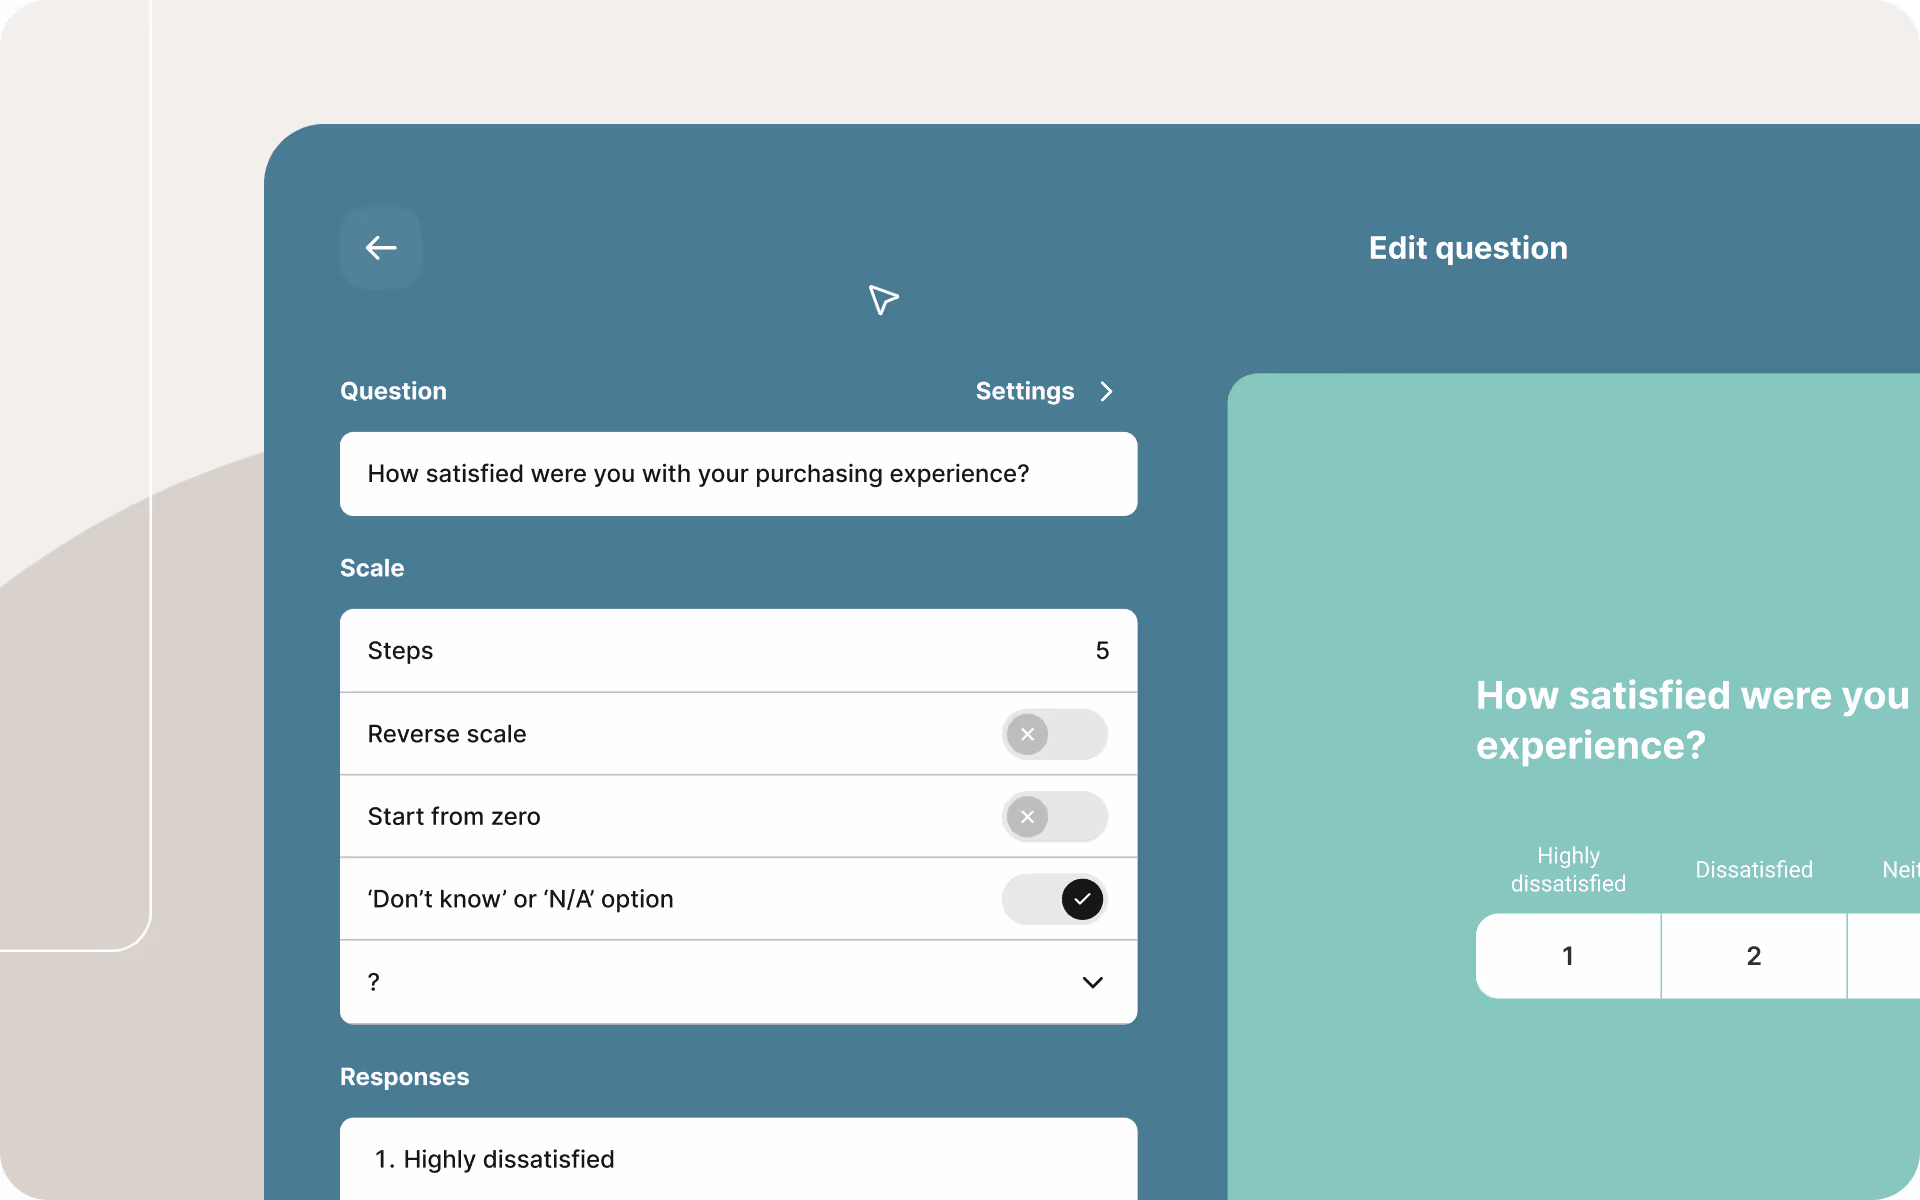
The quality of your questions determines the quality of your data. Each question should contain a single idea and be short, clear, and easy to understand. Avoid leading wording, complex sentences, and double negatives.
Questions like “How satisfied are you with our excellent customer service?” influence responses and should be rewritten into neutral alternatives such as “How satisfied are you with our customer service?”
Clarity and neutrality ensure more reliable answers. (3)
Consequences of bad questions (Don’ts):
These are some of the most serious questionnaire errors, because poor wording completely destroys data quality.
A questionnaire should combine structured and qualitative input.
Closed questions, e.g., scales or multiple choice — provide data that is easy to analyze.
Open questions give room for nuance and depth.
Use open questions carefully, and only where free-text answers create real value. If you need to express results in percentages or trends, closed questions are usually the best choice.
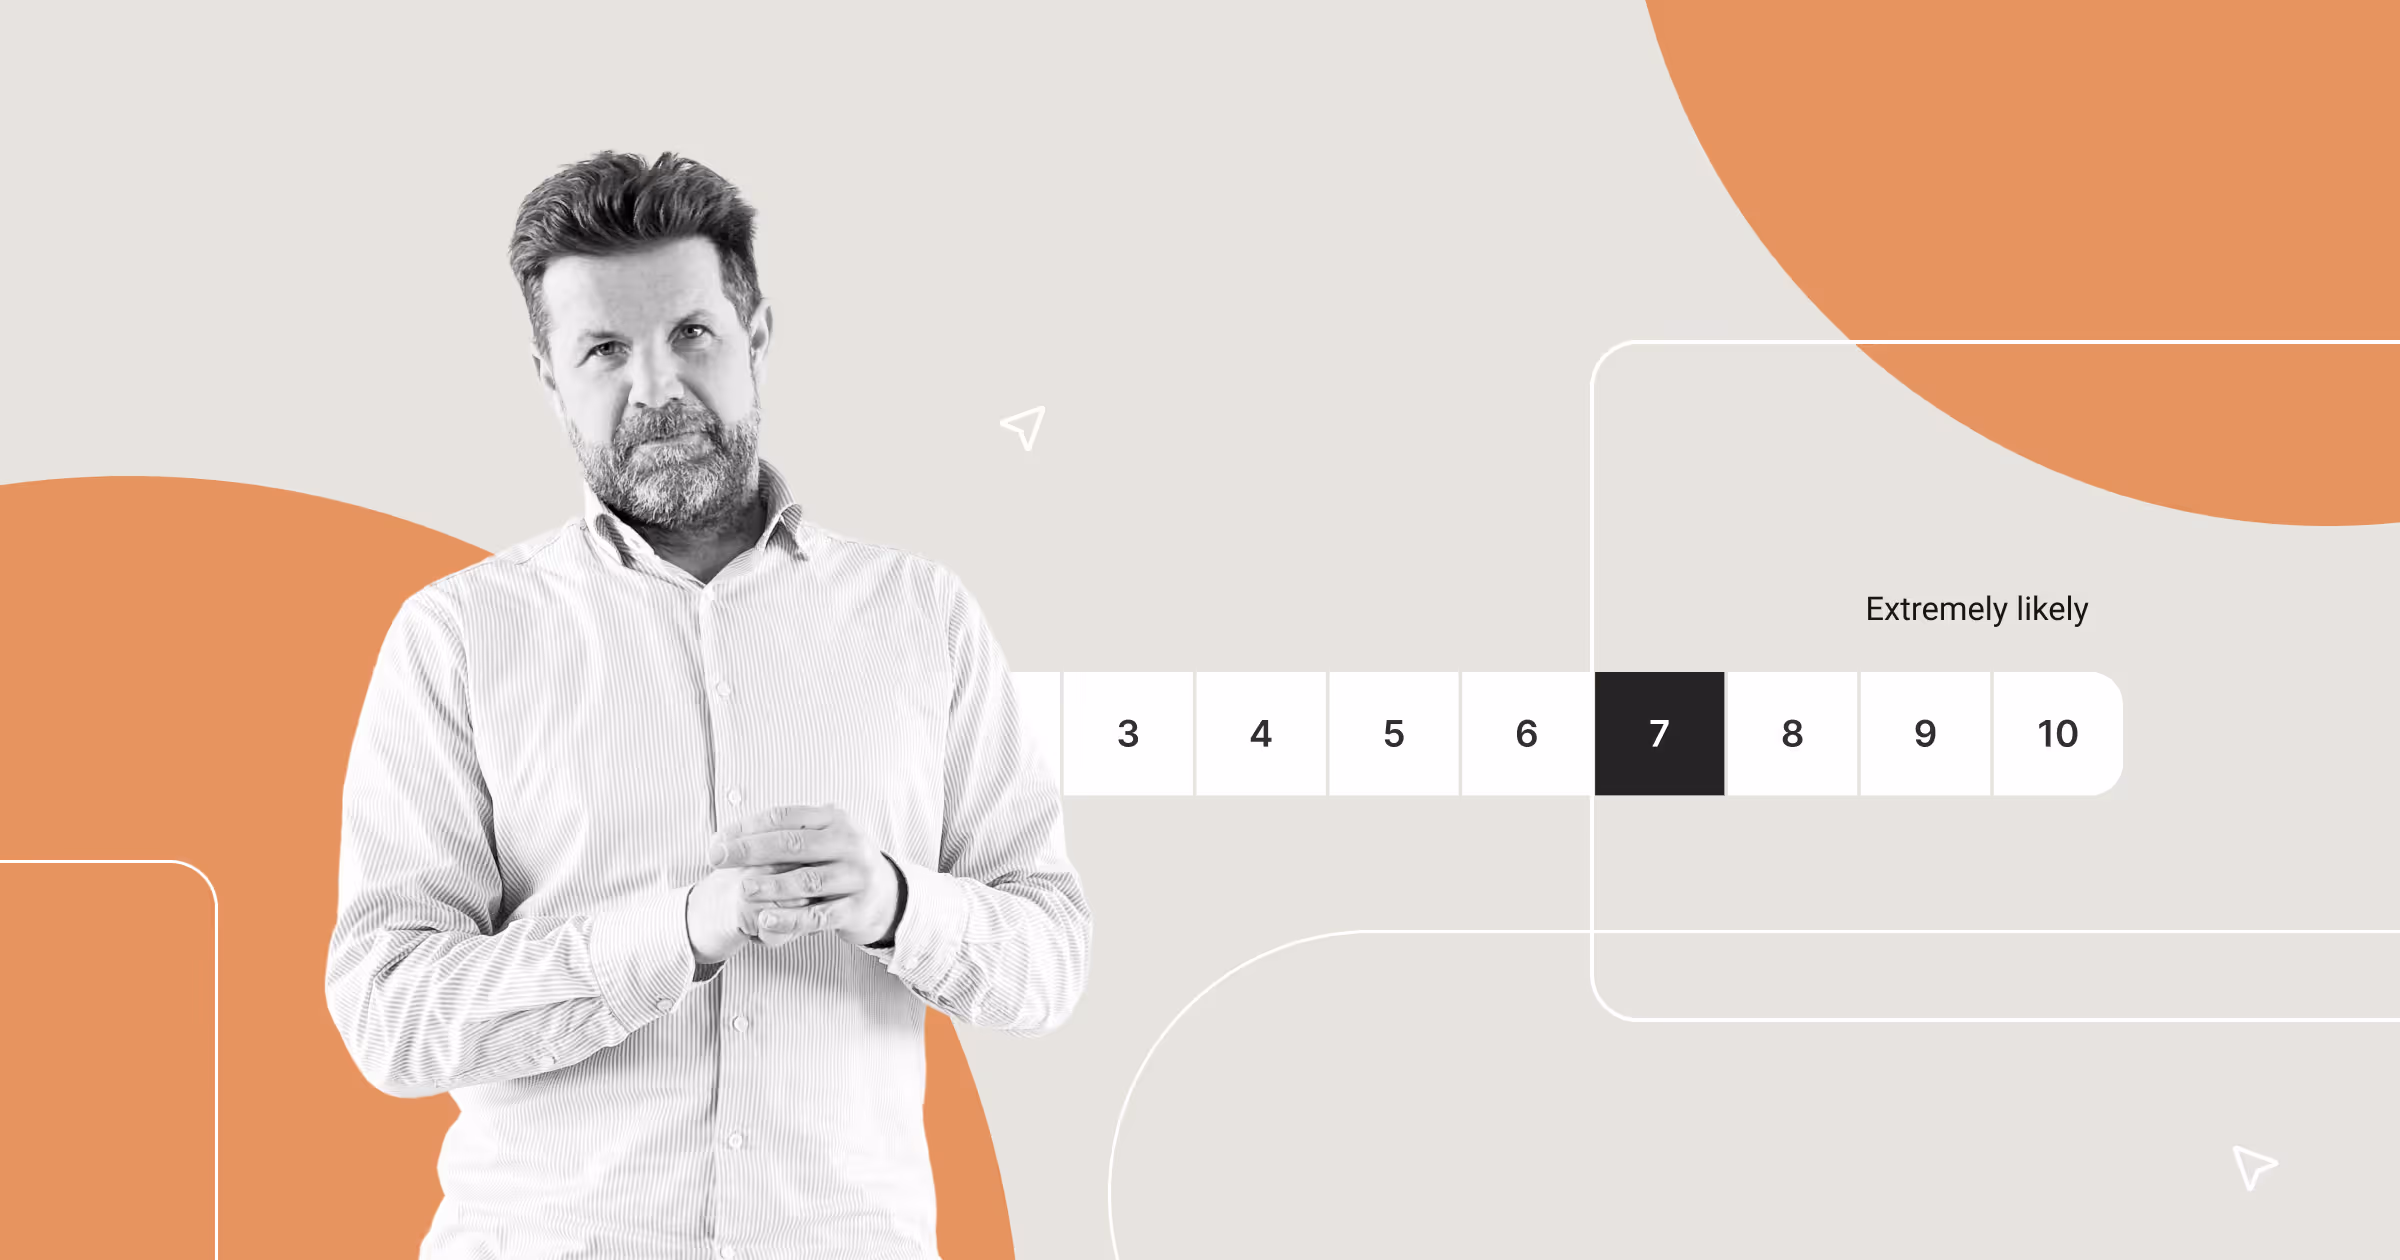
If you use scales, it must be clear what the endpoints mean. Decide whether a neutral midpoint is relevant or if it weakens the results. Add “Don’t know” or “Not relevant” where it supports understanding. (4)
Keep scales consistent (especially for NPS surveys), clearly define the endpoints, and make the scale intuitive and simple.
Consequences of poor scale usage:
A questionnaire should feel logical — like a conversation that moves from the general to the specific. Start with a short introduction describing the purpose, expected time commitment, and anonymity.
A well-tested structure is:
This progression reduces dropout and keeps respondents engaged. (1)
Consequences of poor flow:
Before distributing the questionnaire, you should pilot test it on a small group representing the target audience. Check whether the questions are clear, whether answer options are missing, and how long it takes to complete.
Adjust both the content and the technical setup — especially the mobile view, which most respondents use. (5)
Consequences of not testing:
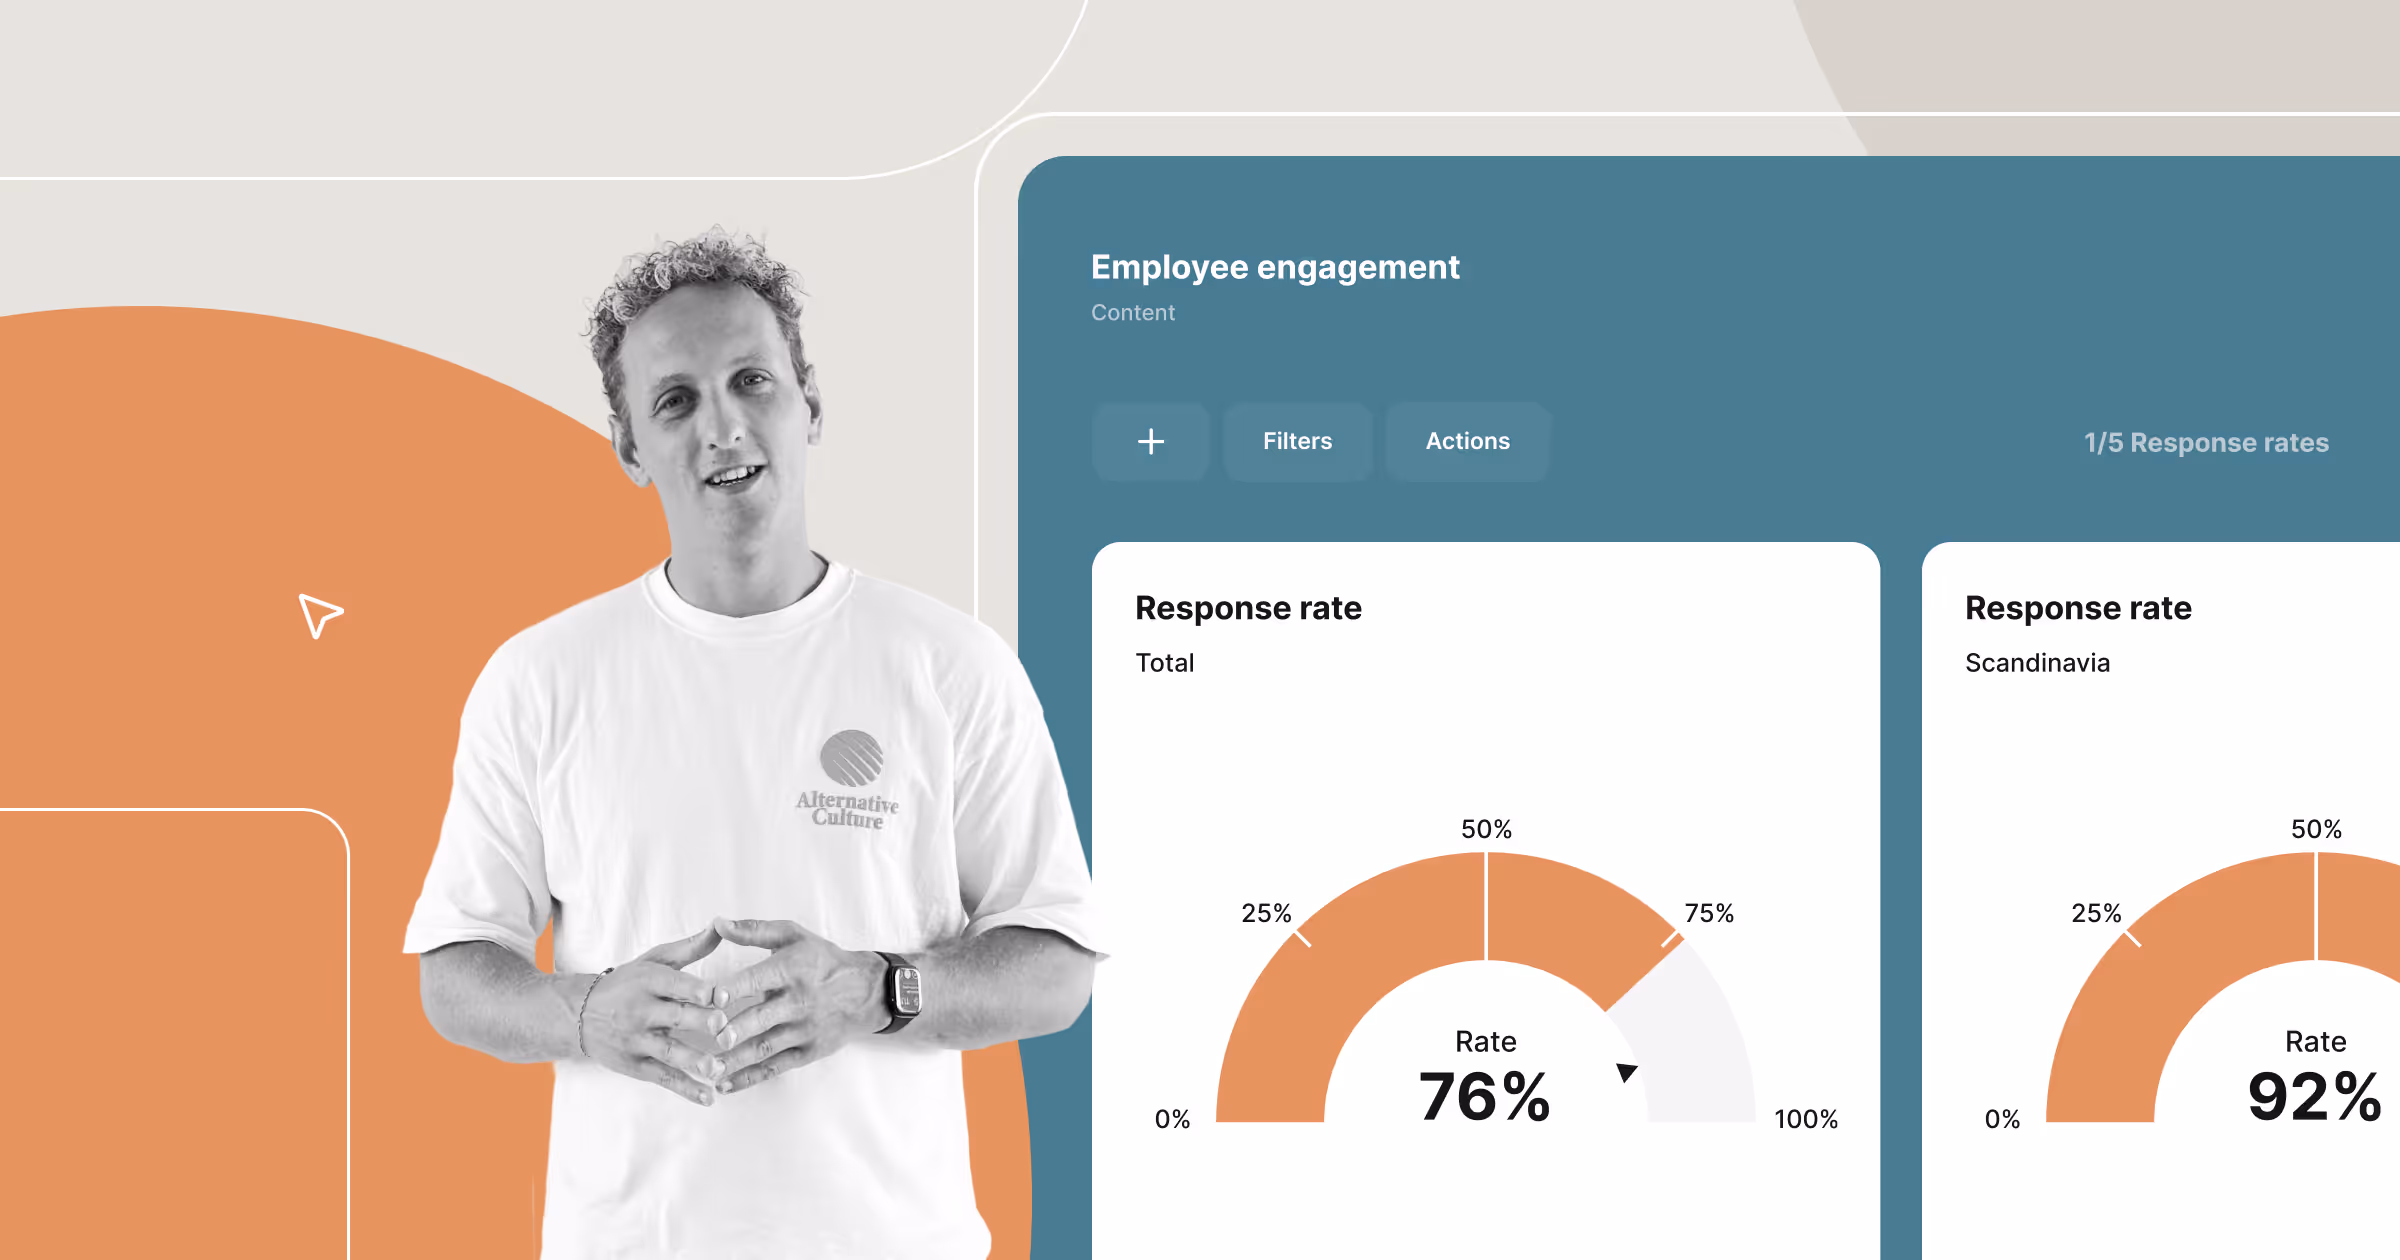
A questionnaire only creates value if the results are used. Once the data is collected, analyze it with a decision focus and share the results with the relevant stakeholders. Communicate which actions will be taken based on the survey.
This shows that you listen — and increases willingness to participate again next time.(6)
The best organizations follow this best practice:
Otherwise, the “Why bother?” effect arises — a fatal survey mistake that kills next year’s response rate. Read more about that in my article NPS Surveys: Best Practices and Proper Application.
How long should a questionnaire be?
Preferably 5–7 minutes, as longer questionnaires reduce the response rate.
How many open-ended questions should you use?
1–2 open-ended questions are usually enough to get qualitative input without creating dropout.
How do you test a questionnaire?
By trying it out on 5–20 respondents and adjusting based on their feedback.
Should you include a neutral midpoint?
Only if it makes sense for the topic — otherwise it may dilute the results.
What is the best way to communicate the results?
Concise, visual, and with clear recommendations or actions.
A good questionnaire requires more than asking questions. It requires planning, understanding the target group, and neutral, well-considered wording. When done right, you don’t just get data — you get insights that drive action.
An effective questionnaire requires: a clear purpose, respondent-friendly language, clear questions, consistent scales, intuitive flow, and thorough testing. These are the six most important survey best practices in the professional world — regardless of whether you work in a municipality, region, state, or private organization.
When you use these best practices and dos and don’ts, you get: higher response rates, lower bias, less dropout, clearer insights, and better decisions.
At Enalyzer, we work every day to make that process simple and professionally sound. We help customers with everything from customer satisfaction surveys and employee surveys to leadership evaluations and surveys integrated directly into their internal systems, such as CRM platforms.
Read more under Services.
Henrik Nielsen is Head of Research at Enalyzer and an external lecturer at Copenhagen Business School. He works with the development of advanced questionnaires, methodological design, and the implementation of analysis projects across industries.
Henrik has extensive experience with survey methodology, data modeling, and the operationalization of measurements in large organizations. He advises both Danish and international companies on creating valid measurements, ensuring methodological consistency, and converting complex datasets into decision-relevant insights.
We'll match you with the right expert.