A comprehensive, research-based guide to NPS surveys - Net Promoter Score (NPS) and Employee NPS. Learn how the method works and how to apply it correctly.

The NPS framework was formally introduced in Harvard Business Review by Reichheld (2003). In “The One Number You Need to Grow,” he demonstrated that the simple question - "How likely are you to recommend…?" - was strongly predictive of behavioral outcomes such as retention, referrals, and future spending. Reichheld’s analysis showed that promoters and detractors behave fundamentally differently, and that organizations with a higher share of promoters often outperform competitors in revenue growth (Reichheld, 2003; Morgan & Rego, 2006). This insight helped establish NPS as a global standard.
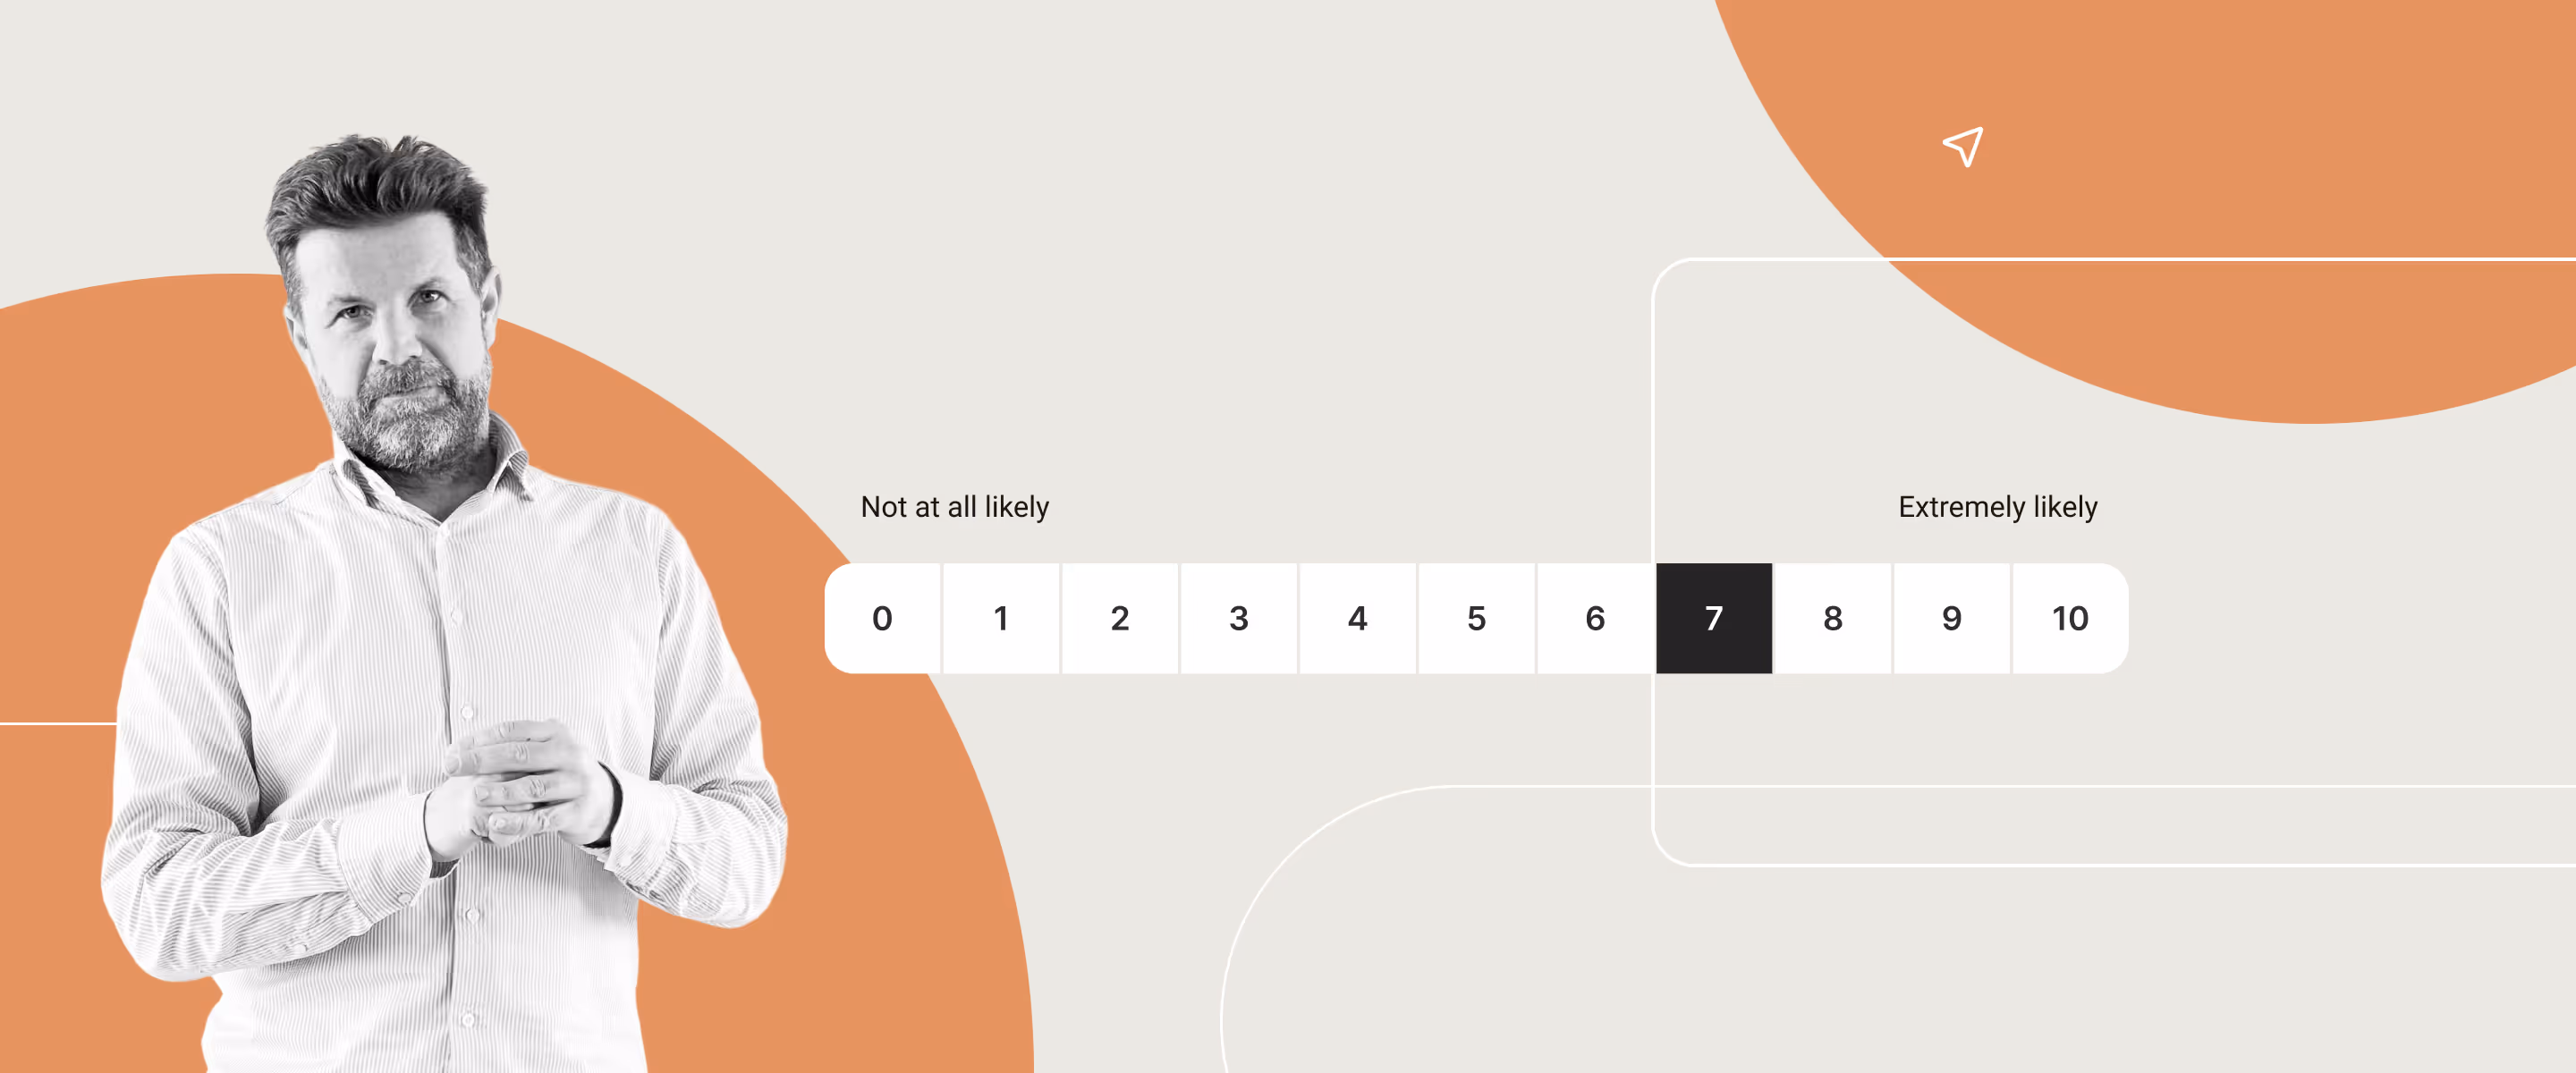
NPS is built on one question:
“How likely are you to recommend this company/product/service to a friend or colleague?”
Respondents answer on a 0–10 scale. Research shows that this question is highly correlated with real behavior such as retention, repurchase, and word-of-mouth activity (Zeithaml, 2000; Kumar, Petersen & Leone, 2013).
But the real analytical power lies in the segmentation model that divides customers into three loyalty types.

NPS classifies respondents into three groups, each representing a different level of loyalty and risk:
Promoters genuinely value your product or service. Studies show that they exhibit higher repurchase rates, longer customer lifespan, and stronger word-of-mouth behavior (Kumar & Reinartz, 2016). Their positive sentiment tends to spread, contributing significantly to organic growth.
Passives feel satisfied but lack the deeper emotional connection that drives strong loyalty. They do not harm your reputation, but they are also unlikely to promote you. Because their attachment is shallow, they are more susceptible to competitive offers—a finding consistent with switching-behavior studies (Morgan & Rego, 2006). Fortunately, small improvements in experience can often elevate them into the promoter group.
Detractors are dissatisfied to varying degrees. Research shows they are significantly more likely to churn and more prone to negative word-of-mouth (Keiningham et al., 2007). Their feedback often highlights structural or service issues that leaders must address. Engaging with detractors quickly can meaningfully improve retention outcomes (Grisaffe, 2007).
These three categories create a simple yet powerful model for understanding loyalty dynamics and future behavior.
The formula is straightforward:
NPS = % Promoters – % Detractors
A positive NPS means you have more promoters than detractors; a negative one means the opposite. Benchmarks vary widely, so comparisons must be made within your industry (Morgan & Rego, 2006).
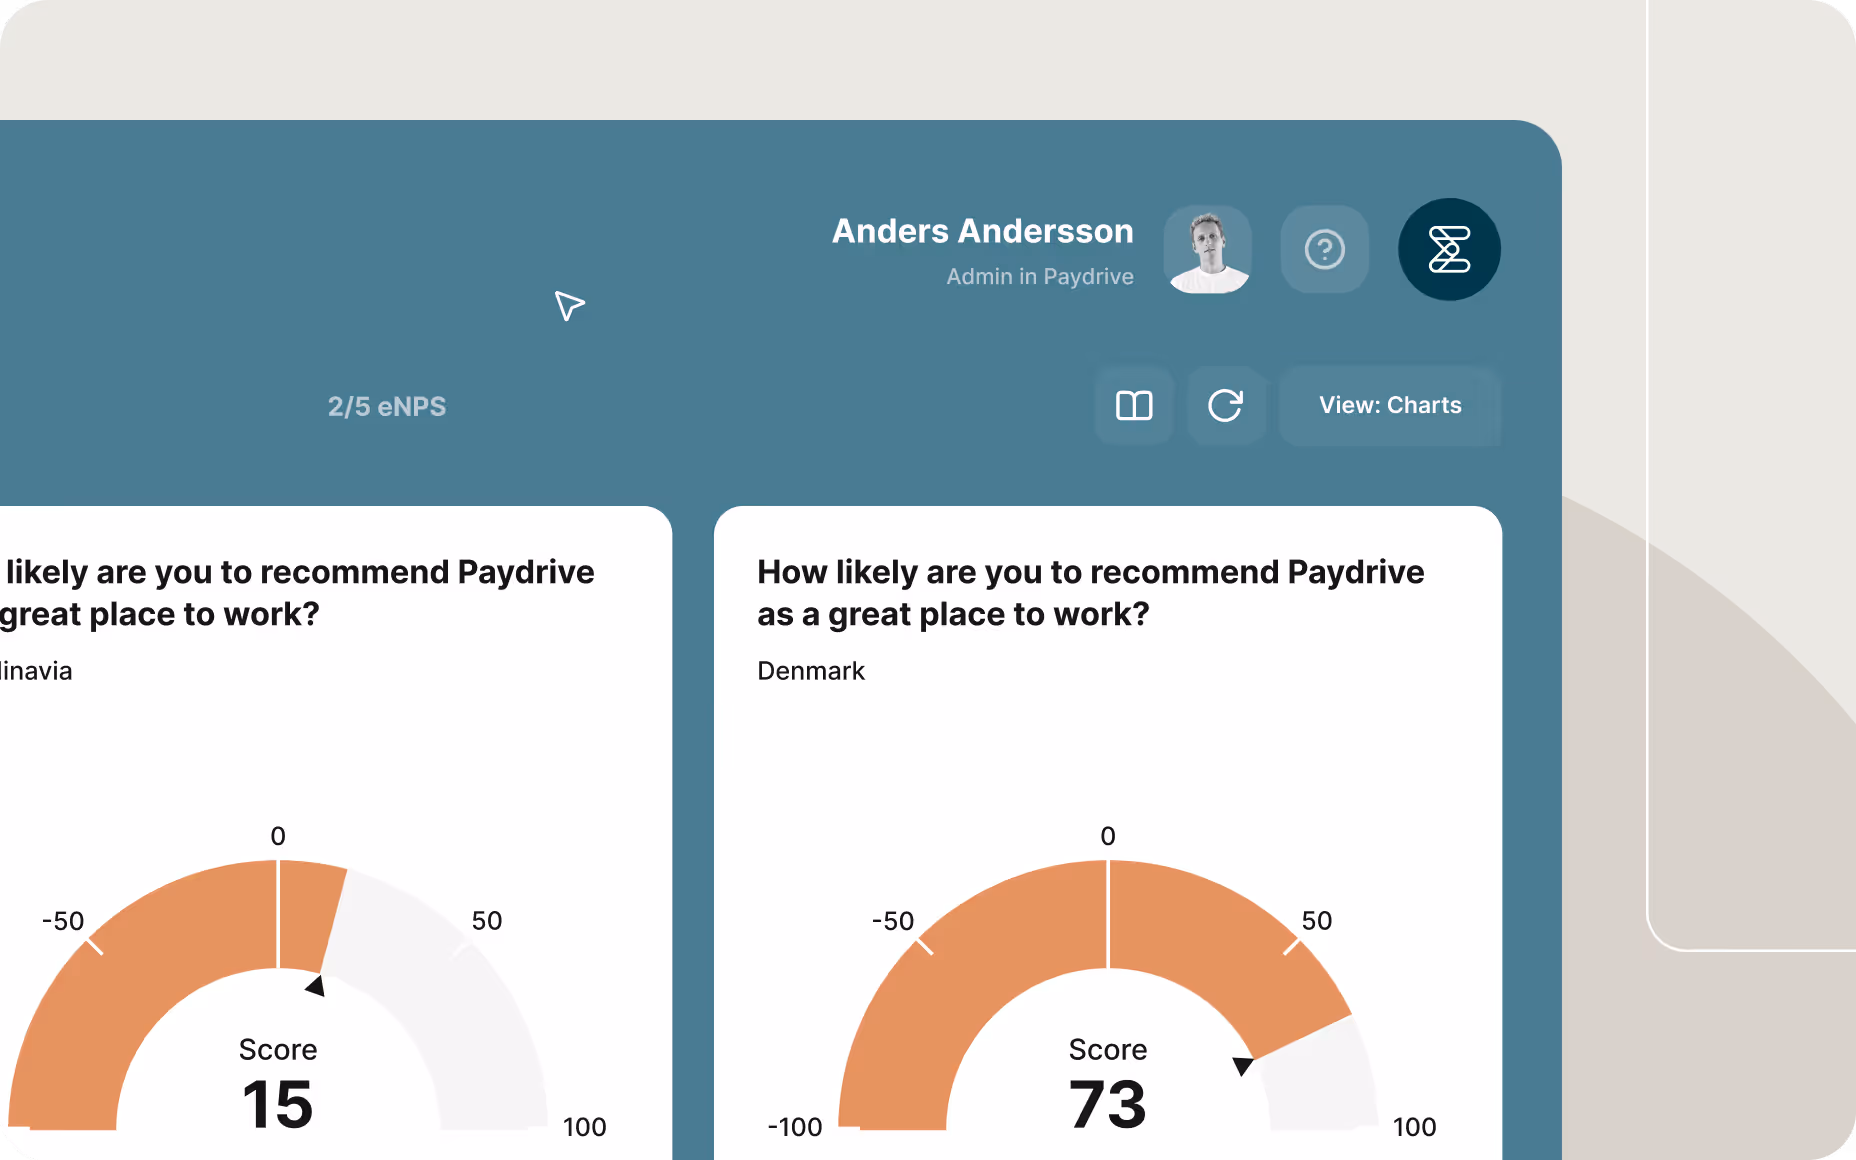
The Employee Net Promoter Score (eNPS) adapts NPS to the workplace with the question:
“How likely are you to recommend your organization as a workplace to a friend or someone in your network?”
The segmentation carries over—but the meaning shifts.
These are proud employees who bring positive energy into the workplace. Research on engagement links this group with higher productivity, lower turnover, and better cultural stability (Harter, Schmidt & Hayes, 2002).
Passives are fine with the job but not fully committed. They may not actively disengage, but they do not contribute the energy and advocacy that promoters do. They are easily influenced by changes in leadership, workload, or communication.
Detractors feel disconnected or frustrated. They may quietly consider leaving and may share negative impressions in their networks. Their feedback often reveals deeper cultural, leadership, or structural problems.
Tracking eNPS over time is an efficient way to monitor shifts in engagement and workplace sentiment.
Academic discussions often question whether NPS is sufficiently scientific. The practical answer is:
Multiple studies confirm that NPS correlates with customer loyalty, retention, repurchase, and referrals (Morgan & Rego, 2006; Kumar & Reinartz, 2016). This makes it valid for capturing overall loyalty sentiment.
But NPS must be paired with comments, because the score alone cannot explain why people feel the way they do.
NPS is reliable at group level and trend level, which is how it’s meant to be used. Like all single-item measures, individual variation is normal—but patterns at scale remain stable and meaningful (Keiningham et al., 2007).
The short version:
NPS is valid, reliable, and highly useful when used to monitor trends and supported by comments.
NPS shows what respondents feel. Comments show why they feel that way.
When organizations combine the score with:
NPS becomes a continuous improvement tool rather than a vanity metric (Grisaffe, 2007).
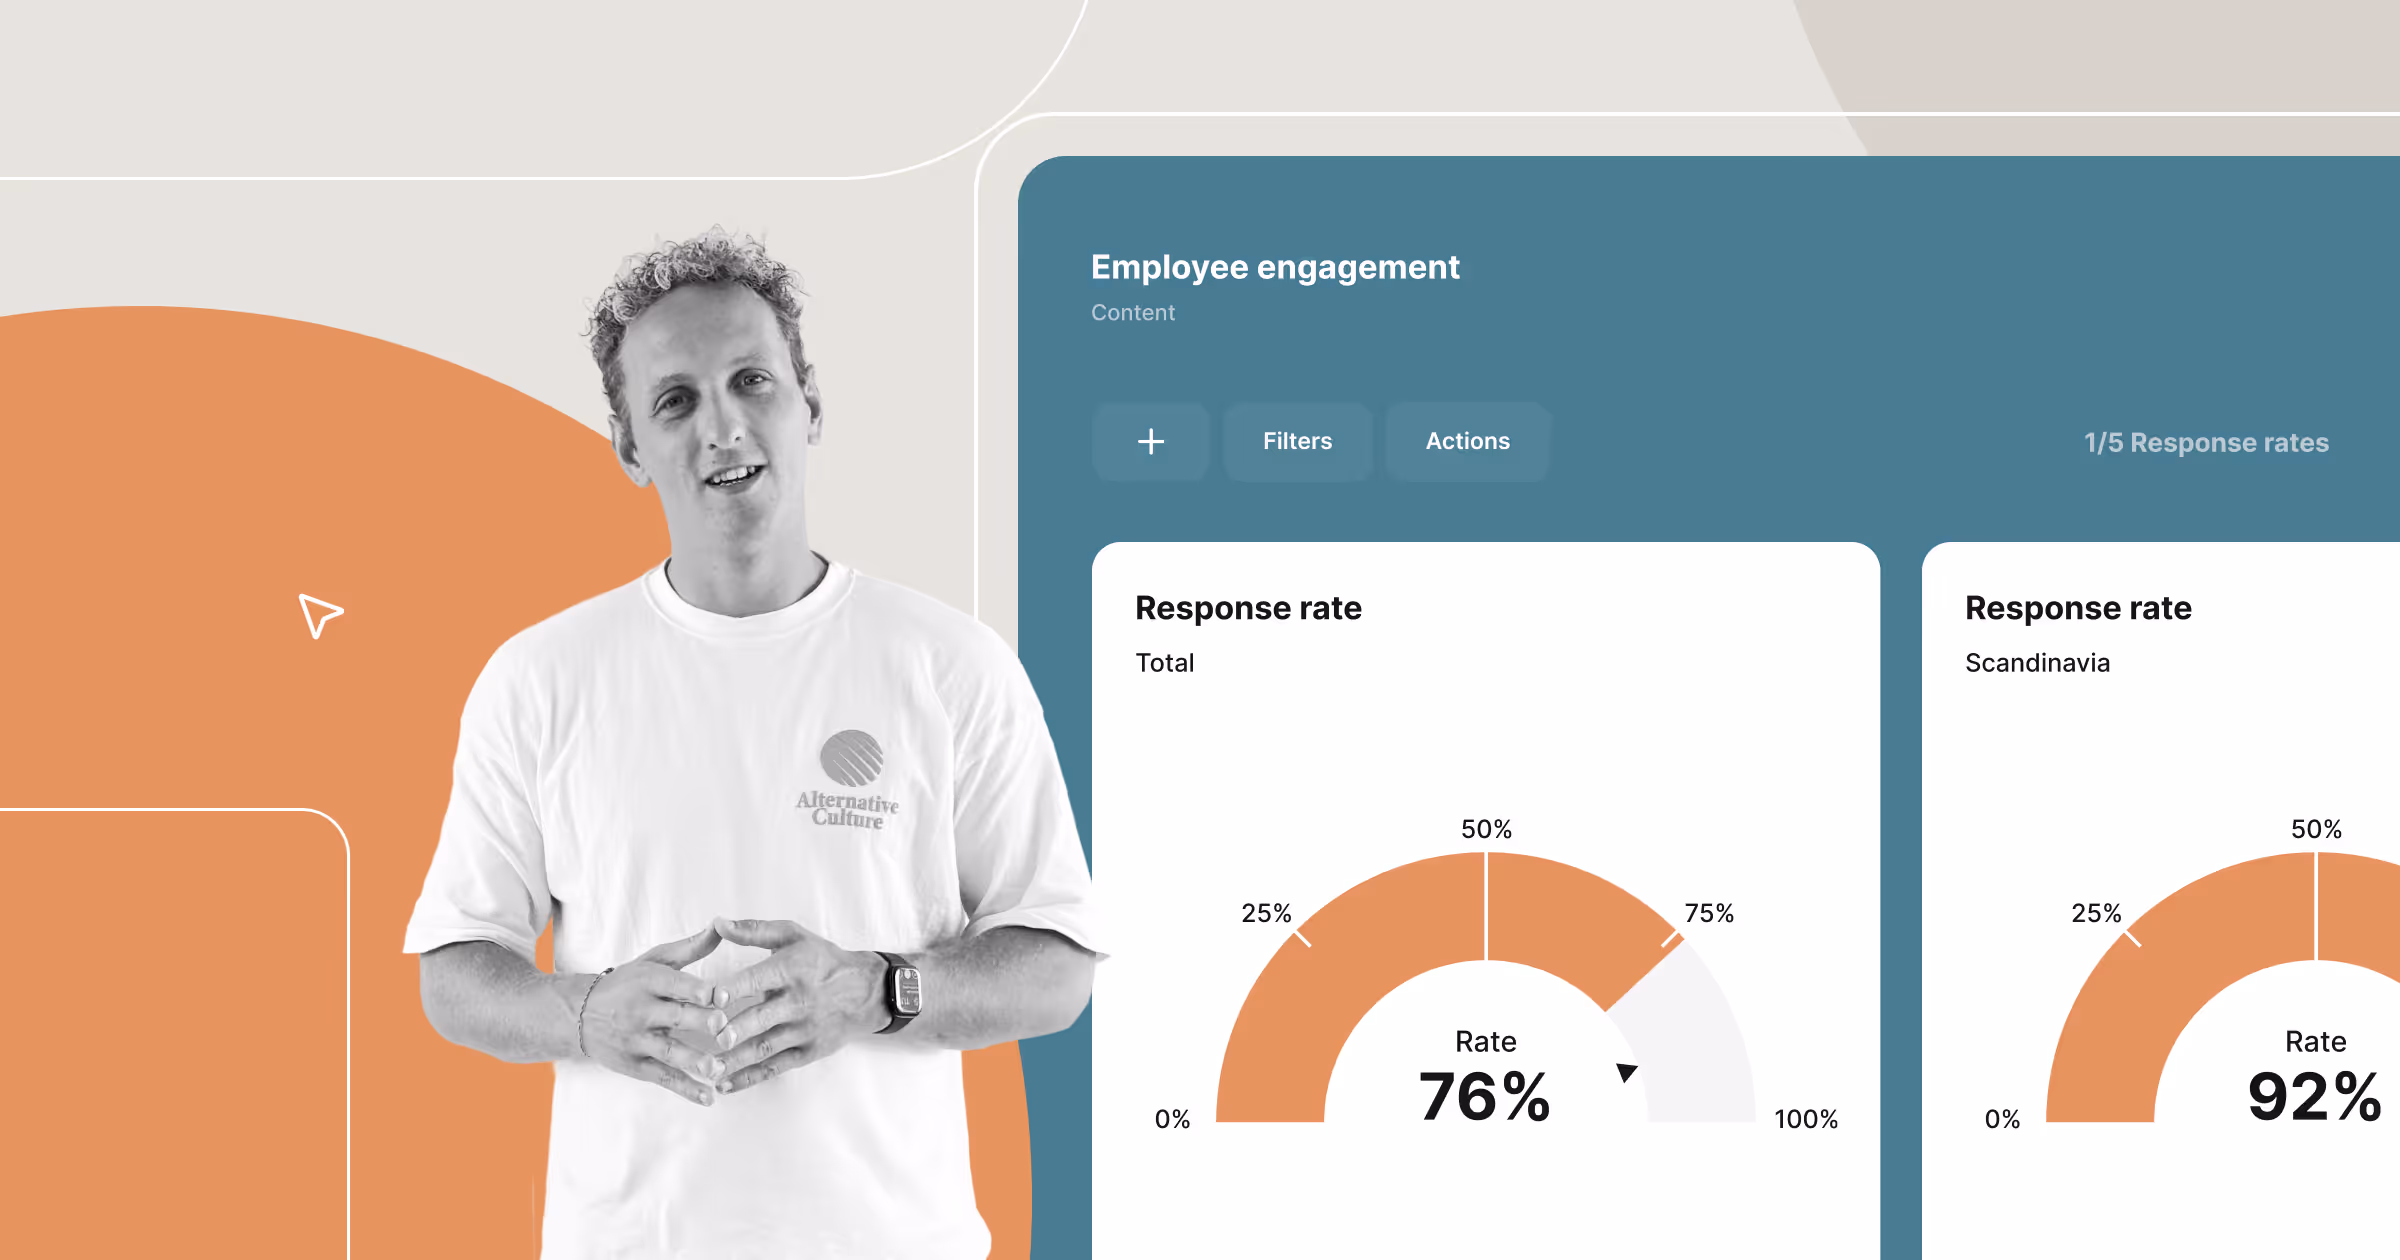
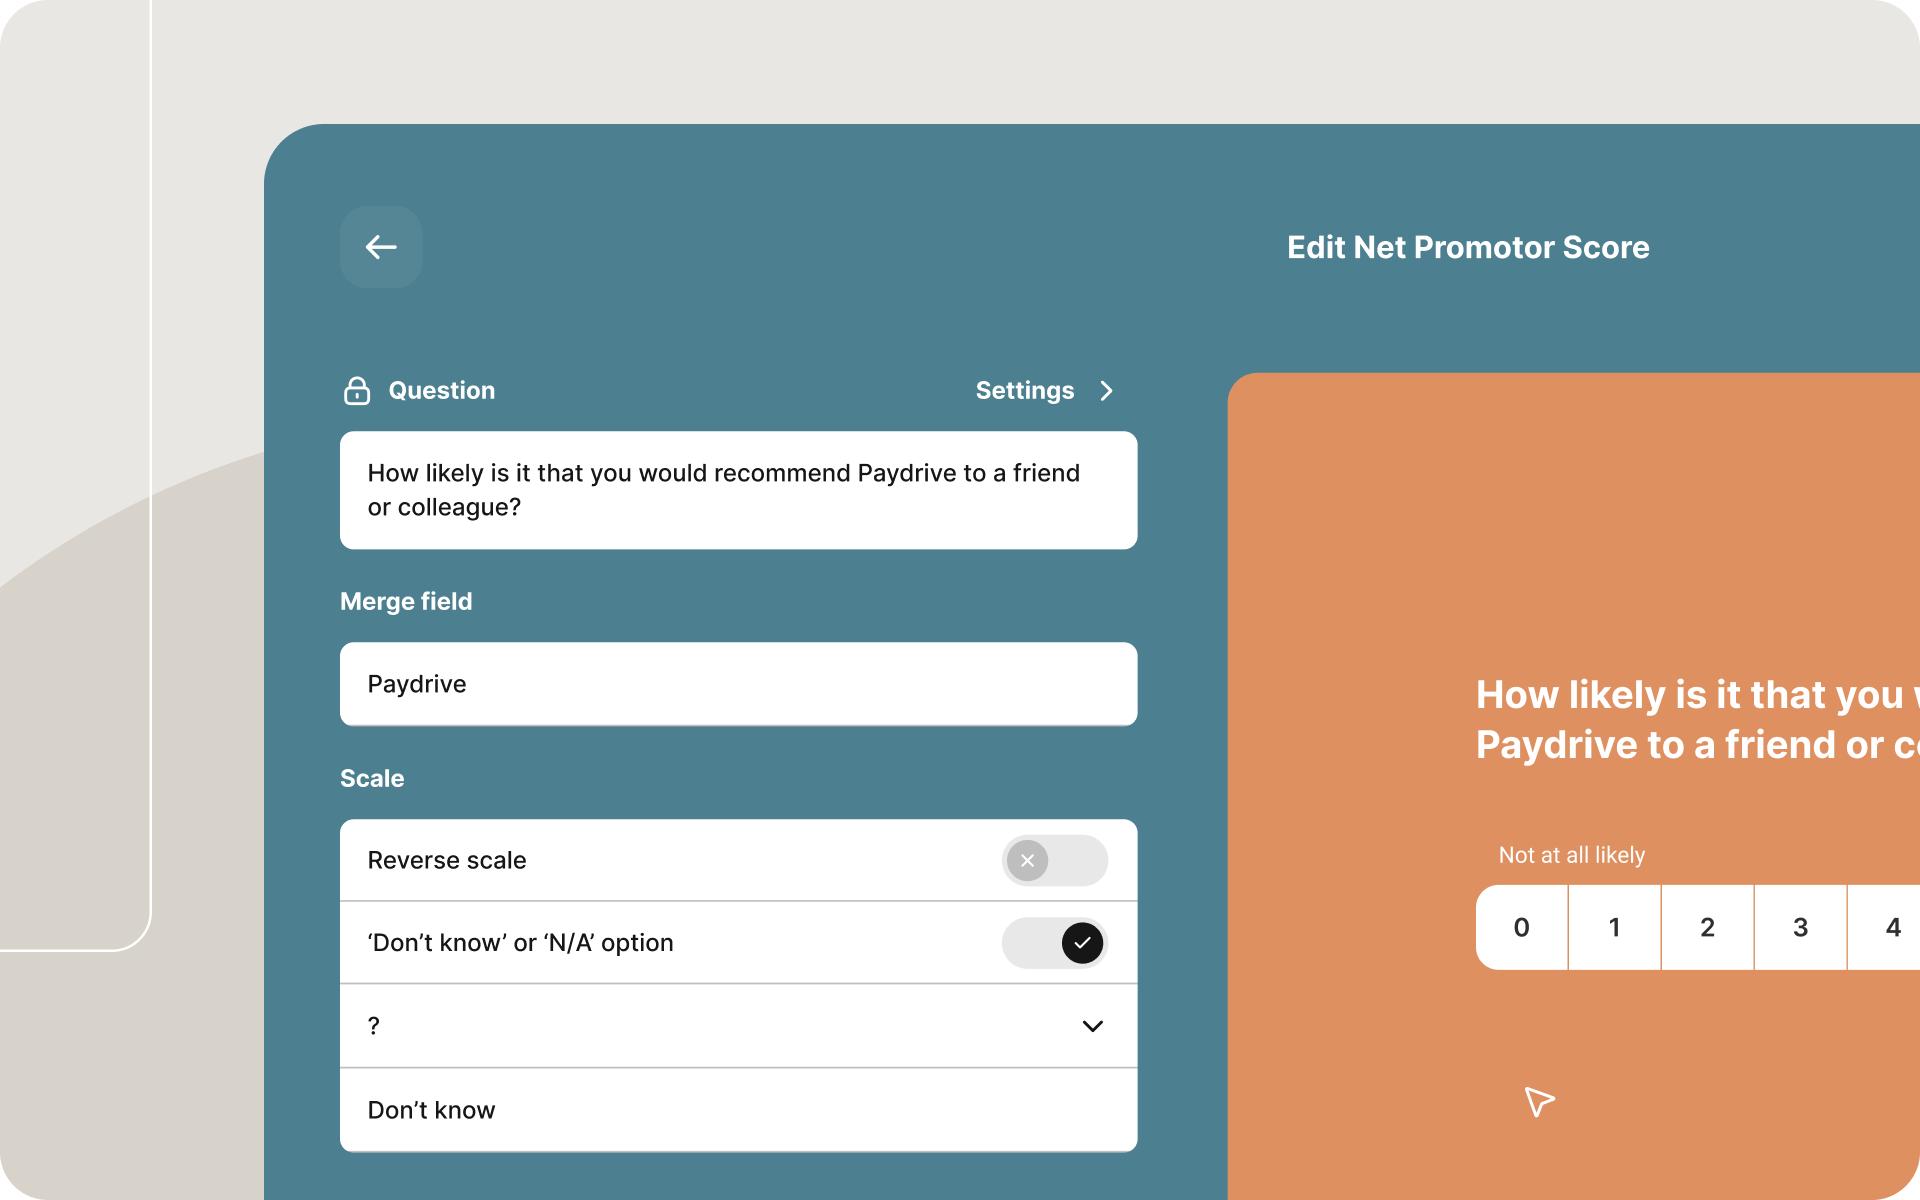
Enalyzer survey tool provides built-in features tailored for NPS and eNPS:
Preformatted with the trademarked text and 0–10 scale
Optional “Don’t know” choice to avoid skewed data
Optional open comment field for qualitative feedback
Enalyzer automatically categorizes respondents as promoters, passives, or detractors and calculates your NPS in real time.
Use time series charts to measure improvements or detect decline after organizational or product changes.
Integrate via webhooks, Zapier, Slack, or Microsoft Teams to receive immediate notifications when detractors respond.
This enables fast follow-up and reduces churn.
If you need a different scale or wording, use Enalyzer’s Recommendation Score question type.
It provides the same segmentation, but with full customization.
NPS surveys remains one of the most intuitive, scalable, and behaviorally meaningful tools for understanding loyalty—both for customers and employees. From Reichheld’s early findings to modern academic analyses, research consistently shows that NPS captures real behavioral tendencies such as churn risk, retention strength, and advocacy likelihood.
Combined with comments, segmentation, and thoughtful follow-up, NPS becomes a powerful improvement framework. With Enalyzer’s optimized NPS survey tool, automation, and analytics, a simple question becomes an engine for better decisions, lower churn, and stronger customer and employee relationships
Is NPS a customer satisfaction metric?
Not exactly. NPS measures loyalty and advocacy, while satisfaction surveys measure experience. They complement each other but serve different purposes.
How often should I run an NPS survey?
Most organizations measure NPS quarterly, bi-annually, or after key touchpoints (e.g., support interactions or purchases).
What is considered a good NPS score?
It varies heavily by industry. As a general guideline, 25+ is a reasonable goal, but always benchmark against competitors in your sector.
Can I change the wording or scale?
Not if you want to call it “NPS.” However, you can use Enalyzer’s Recommendation Score question type if you need flexibility.
Should I ask for comments?
Yes, always. The score tells you what happened; the comment tells you why.
Is eNPS anonymous?
It should be. Employees must feel safe giving honest feedback, which increases reliability.
Can I use NPS in combination with other KPIs?
Absolutely. NPS works best when combined with satisfaction metrics, churn rate, lifetime value, or employee engagement scores.
Henrik Nielsen is Head of Research at Enalyzer and an external lecturer at Copenhagen Business School. He works with the development of advanced questionnaires, methodological design, and the implementation of analysis projects across industries.
Henrik has extensive experience in survey methodology, data modeling, and the operationalization of measurements in large organizations. He advises both Danish and international companies on creating valid measurements, ensuring methodological consistency, and converting complex datasets into decision-relevant insights.
We'll match you with the right expert.